Soybeans Tech Update
Grain Market Commentary
Tuesday, July 7, 2020
by The Andersons Risk Management Team
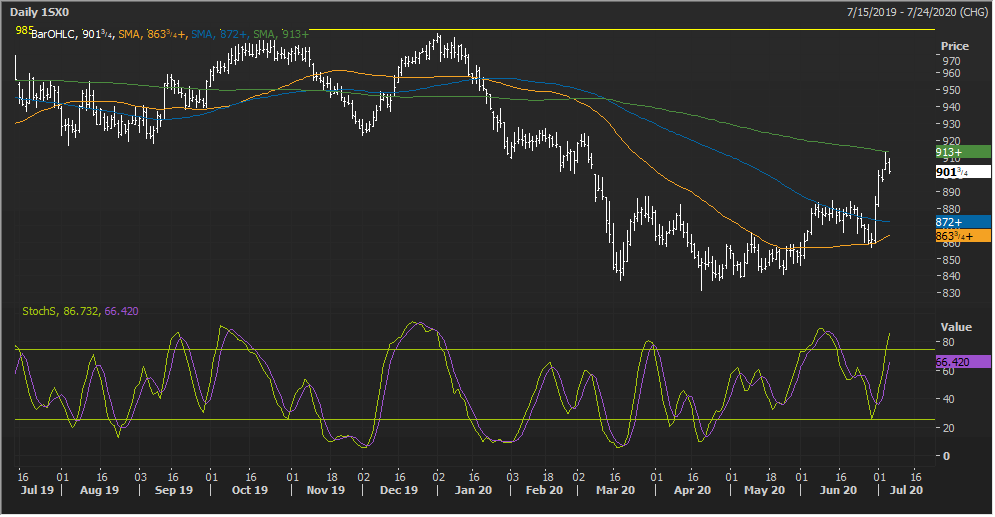
This chart might appear very cluttered at first glance, but we thought it pertinent to illustrate the technical state November soybeans find themselves in currently. Taking into consideration the catalyst the USDA provided, beans have managed to hold on to most of the rally over that period of time. Clearly, soybeans struggled to get follow through in buying, after failing at the 200-day moving average. This recent high and the moving average should both provide some difficult resistance and should be considered a target to take more risk off of the table if we retest.
In the lower third of the chart, we have also included a momentum indicator that helps describe the appetite for continued buying, we are rapidly approaching overbought territory but have yet to get there, if we can sustain a stronger tone, this stochastics should be reviewed carefully as they can help indicate a market sell off pre-emptively. All things considered this technical perspective should be regarded more toward strategically pick spots and time to actively mitigate risk, as we still dwell firmly in the middle of “weather market” season. More volatility should be expected over the next 3-4 weeks as pollination is fundamentally scrutinized and quantified.