Special Market Update
Grain Market Commentary
Monday, July 27, 2020
By Rhett Montgomery, Associate Merchant, The Andersons
CORN
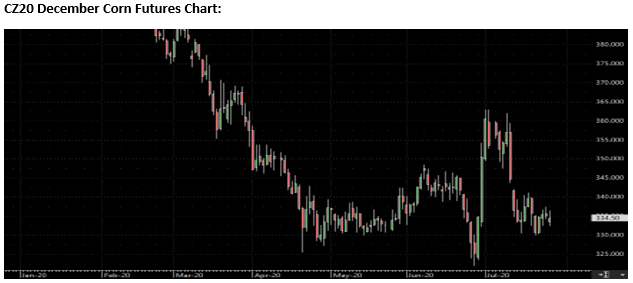
Old crop September corn traded 1.25c lower to start the week closing at $3.25, while new crop December 2020 corn was down half a cent, closing at $3.3450. Trade today was mixed trading slightly higher on the overnights before trading a couple pennies down for most of the day session. The market has consolidated in the past 7-10 days as it attempts to balance less threatening weather in the second half of July across much of the Midwest, with more optimistic demand prospects as the economies continue to recover from the March/April COVID shutdown, as well as China’s hog industry rebounding from the African Swine Fever outbreak in late 2019/early 2020.
Rain coverage continues to improve with much of the Midwest looking to receive some coverage this week before things turn dryer again over the next 10 days. The crop concerns over the first half of the month that led to the three-day 40c rally seem to have subsided for the most part. The USDA in their July WASDE report kept the 2020 yield unchanged at 178.5. It seems that many in the trade feel that number is on the high end, so the question now becomes how much of the top end did the hot June and dry first half of July take off of the corn yield and will the USDA adjust and at what pace. Crop conditions have been unchanged the past two weeks at 69% Good/Excellent. Overall feeling is that those should improve in this afternoons Crop Progress report out at 4pm EST.
On the opposite side of the balance sheet, demand is currently very strong as China has booked a considerable amount of U.S. corn primarily for the 2020/21 crop year. It is important to remember that China is a closed system when it comes to corn, importing only around 5-7 million metric tons per year. So far, the U.S. has booked just under 4 million metric tons for export to China in 2020/21, the previous record for the U.S. is 5M in 2011/12. Overall, the recent pace of corn export sales puts the U.S. on pace to meet the USDA estimate for the 2019/2020 crop but has many believing that the 2020/21 USDA estimate is now too light given the recent business with China.
In technicals, December corn has held support three times when testing 3.30 but has failed to recover above $3.40. The move is currently stuck in an increasingly tight range. The target for any rally would be to fill the gap from the 13th of July with a move up to $3.4175. Beyond that resistance is at $3.47. Any move lower would meet support at $3.30, followed by $3.27 and lastly the late June low of $3.22.
SOYBEANS
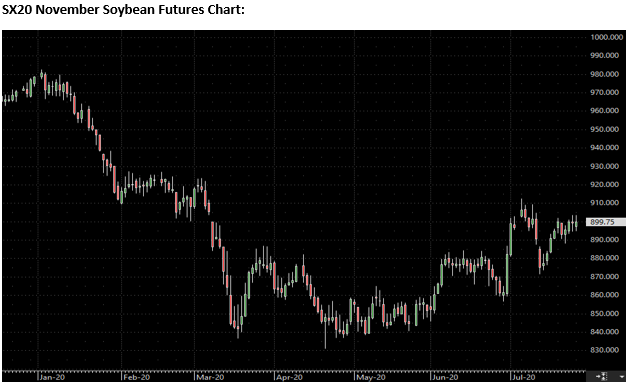
November soybeans traded up half a penny, closing at $8.9975 to start the week. Support today came from an early morning announcement of a daily sale of soybeans to China and Mexico for 2020/21 totaling about 380K metric tons. Outstanding sales to China for the next crop year now stand at the highest level since 2013/14. The flip side of this story is that on old crop beans Brazil continues to be far and away the main supplier of soybeans to China, shipping a record total thus far, with a huge June number which was double June 2019’s level. U.S./China relations also continue to be a roller coaster as last week China closed its consulate in Houston and the U.S. responded by closing its consulate in Chengdu, this has kept the soybean market in check as it again struggled to sustain any price movement above $9.00.
On the supply side of things, although weather and yield prospects look fairly good thus far and have improved slightly throughout July, August is really the key month for soybeans and the weather will be very important to watch as it will set the tone for what kind of bean yields we will be seeing come fall. Currently the USDA is using a 49.8 BPA yield vs last year’s final yield of 47.4 BPA.
In technicals, today marks the 4th time in the past 6 trading sessions that the market has traded above but failed to close above $9.00. We saw closed at $9.00 even on 20th and 23rd but both days were followed by down days the next day. If we were to break the $9.00 resistance any move to the upside would be met with resistance at the 200 day Moving average at $9.09. Any move to the downside would have support levels at $8.95, and below that at $8.88.