Special Market Update
Grain Market Commentary
Monday, October 26, 2020
by Chris Hillburn, Senior Merchant, The Andersons
Corn
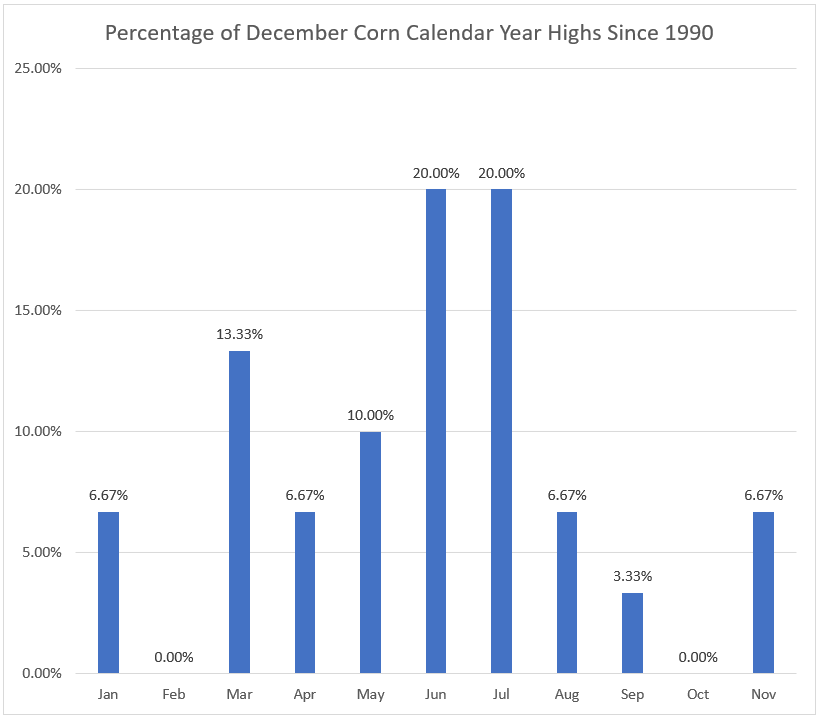
If you thought this year was unusual in terms of Trade Wars, Corona Pandemic, Politics, and Economic Policy, one more factor to consider. Look at the chart below. It shows the calendar year highs for December corn futures going back to 1990. Notice that the chart shows we have never had a calendar year high for December corn futures in the month of October. This year our calendar year high was in January 2020 at $4.0475. Last week saw December futures touch $4.20. This is now the first time in 31 years that this has occurred in October. So much for seasonals and harvest pressure.
Another factor to consider is the October USDA WASDE report and corn spreads. October ending stocks did decline but still came in at 2.167 billion bushels and the Stocks to Use ratio was 14.86%. On the surface nothing bullish about those numbers and normally would see significant carry in the corn market. Instead, funds have been aggressive buying the front month corn contacts and the carry from December to March is now about 1ct, and the carry from December to May/July is 2 cts. Market is trading strong demand and wanting the corn up front. In fact, market is trading a smaller ending stocks number. At the same time, at least here in South Central Nebraska, basis levels are steady to stronger, again indicative of a strong demand driven market. Question is how long does this continue and when will end user get the corn bought that they need? How much corn does China ultimately buy?
Downside risk looks to be more Macro driven. Corona cases on the rise and will the U.S. economy see widespread shutdowns? This could lead to ethanol plants reducing grind or shutting down, aka 2020. Political tensions between China and the U.S., no passage of new stimulus package, and a possible contested Presidential Election. Any or all of these could lead to large risk off trade in Stocks and Commodities.
Technicals: Life of the contract high for December futures is about $4.23, so pocket of resistance at $4.20-$4.25. A close above $4.30 would be extremely bullish and would open the way to a rally up to $4.64, June 19 high on lead month futures. A correction in the corn market would take us down to $3.95-$4.00. Major turning point to the downside on corn would be $3.75 per the charts, indicating the party is over.
Funds are now over 200,000 net contracts long corn. If the funds are momentum traders, then would look for rallies to be accompanied by rising open interest, as new longs come into the market. Remember that in a momentum driven market the biggest long position will occur at the top and typically Spec Funds will overshoot versus fundamentals. The opposite is also true and fund momentum selling will overshoot to the downside, as we saw in April.
Sum up the market with strong basis levels, futures over $4, and no carry indicating the market is looking for corn sooner than later.
Soybeans
Soybeans are another strong demand driven market. Massive buying by China. Question is how much and for how long before China switches purchases to South America. Normally, looking at soybean shuttles or unit trains, that market will dry up by the end of February as China will source YSB from SAM vs the U.S. Basis at the grain elevators that load soybean shuttles will provide a clue as to what demand is doing. Another factor to watch is soymeal. Look at the lead month futures for soymeal, difficult in the last 4-5 years for soymeal futures to get over $400 per ton.
Technicals: Resistance at $10.90 November futures and then at the $11-$11.20 mark. Close above this would put us in range of $11.40 to $11.70 futures if the market goes into full blown rationing. On the downside, the big pivot point would be $9.70 and the rally would look to be over.