Special Market Update
Grain Market Commentary
Tuesday, May 11, 2021
by Rhett Montgomery, Associate Merchant, The Andersons
Corn
It was a turnaround Tuesday in grains today as old crop July corn traded 10.5c higher, closing the session at $7.2225. New crop December corn was up 2c, closing at $6.1125.
Corn futures managed to regain most of what they lost coming out of the weekend yesterday on what was a risk off start to the trading week. Heavy rain coverage across the Midwest as well as a fast pace to planting in the U.S. had futures pressured yesterday throughout the session. Today we are seeing some more positioning ahead of what is expected to be a bullish WASDE report out tomorrow at 11AM CST/12PM CST. On old crop the market is looking for further cuts in the 2020/21 corn carryout with the average estimates coming in at 1.275B compared to the April USDA estimate of 1.352B. This would push the stocks/use ratio to around 8.5% the lowest since 2012/13. Strong ethanol demand as well as crop concerns in Brazil are the drivers right now in the old crop corn world balance sheet.
Tomorrow’s WASDE will also give us the first forecast for 2021/22. Average trade estimates for U.S. carryout are 1.344B bushels so right in line with where we currently sit right now on this year’s crop. The report will most likely use acreage from the March planting intentions as well as a trendline yield in the 179 BPA range. Assuming demand stays equal/stronger next year it is easy to see these estimates as fair, of course the big question for the 2021 crop is how many acres have been bought with the run-up in corn futures? The soybean/corn ratio went as low as 2.25 which would indicate more corn acres coming in the June 30th plantings report. A 3-4M acre increase all things equal would push the carryout back into the 1.8-9B area.
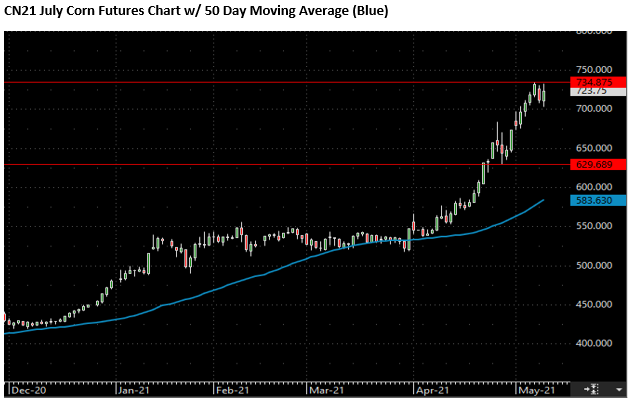
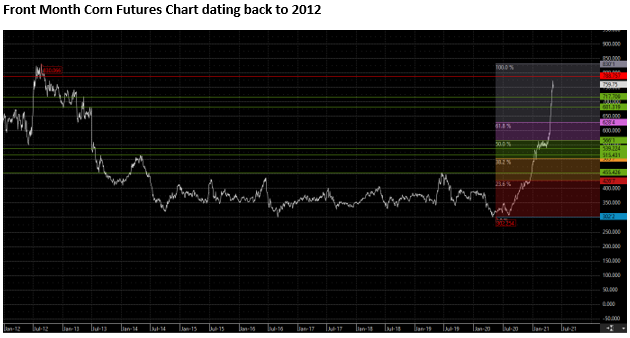
In technicals, the market continues to be overbought but as continually ignored chart “sell” signals in favor of a bullish fundamental story as the market continues its straight shot up. $1.70 rally in the last 30 days on the July board. In short term targets, the market is testing the highs from last week, $7.75 on the May board and $7.35 on July, a close above these numbers would set a longer term price objective of 7.88 on front month corn, a peak from 2012. Beyond that, 100% retracement to 2012/13 would be $8.30 on front month futures. In the case of a bearish surprise from the USDA or a demand shock of some sort, downward targets in the short term would be support from the end of April at $6.27. Beyond that it is worth noting the 50-day moving average is at $5.83, which further illustrates just how explosive this rally has been over the past couple weeks.
Soybeans
Old crop July soybeans traded up 27.25c, closing at $16.1475. New crop beans finished up 17.25c, closing at $14.3150.
Like corn, beans recovered from Monday’s selloff by pushing to new highs on old beans and trading within 7c of last weeks highs on November soybeans. The story is a similar one to corn in that the market is bracing for what should be a neutral to bullish report tomorrow. The trade is expecting a 117M bushels carryout for 2020/21 soybeans compared to the 118M number from April, so should be quiet on the old crop front. The interesting numbers will be the new crop 2021/2022 estimates, carryout trade guess average is at 138M. At a trendline yield and March acreage projection this leaves very little room for any error during the growing season or we will find ourselves right back to where we are this year in terms of soybean carryout. Beyond tomorrows report, the corn/bean mix for the June plantings report will be interesting, even if the USDA were to estimate a 1M acreage increase in soybeans, that only increases the carryout to the 180-190M range. Not bullish compared to where we are today with futures north of $16, but not necessarily bearish either with a July/August weather still ahead. Also, it’s worth re-visiting that a 1M acreage increase seems high now considering the corn/bean price action over the past month or so. How corn/soybean prices trade in respects to one another will be very interesting post the June report if the soybean scenario remains bullish but corn’s story turns more neutral to bearish.
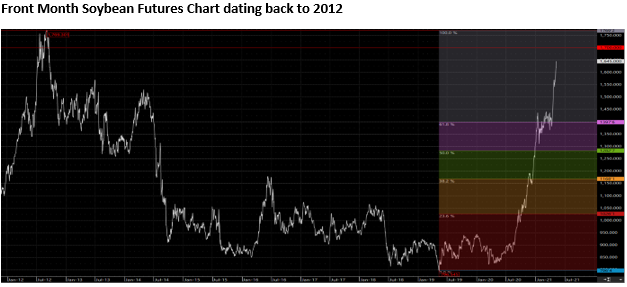
In technicals, like corn the run up in the past 30 days has left the moving averages in the dust. The 50-day moving average on July beans sits at $14.45, $1.75 below todays close. For upside targets, looking at the front month futures chart dating back to 2012 the high was $17.70. We have currently retraced about 93% of that. The May board is still the leading month and $16.50 seems to be giving resistance right now, beyond that the $17.00 level is one to keep an eye on for potential resistance to any move higher. To the downside, any bearish news would have support in the $16.00 area and below that all the way to $15.00 would be a potential downside target for a selloff. When the market has gone up in 25-30c days it is fair to think that whenever a selloff occurs from the funds, the downside to this will be similarly volatile.